American Energy
Data Visualization / Graphic Design / Poster / Research
Studio Work on Data Visualization
Pratt Institute (2018)
ABOUT
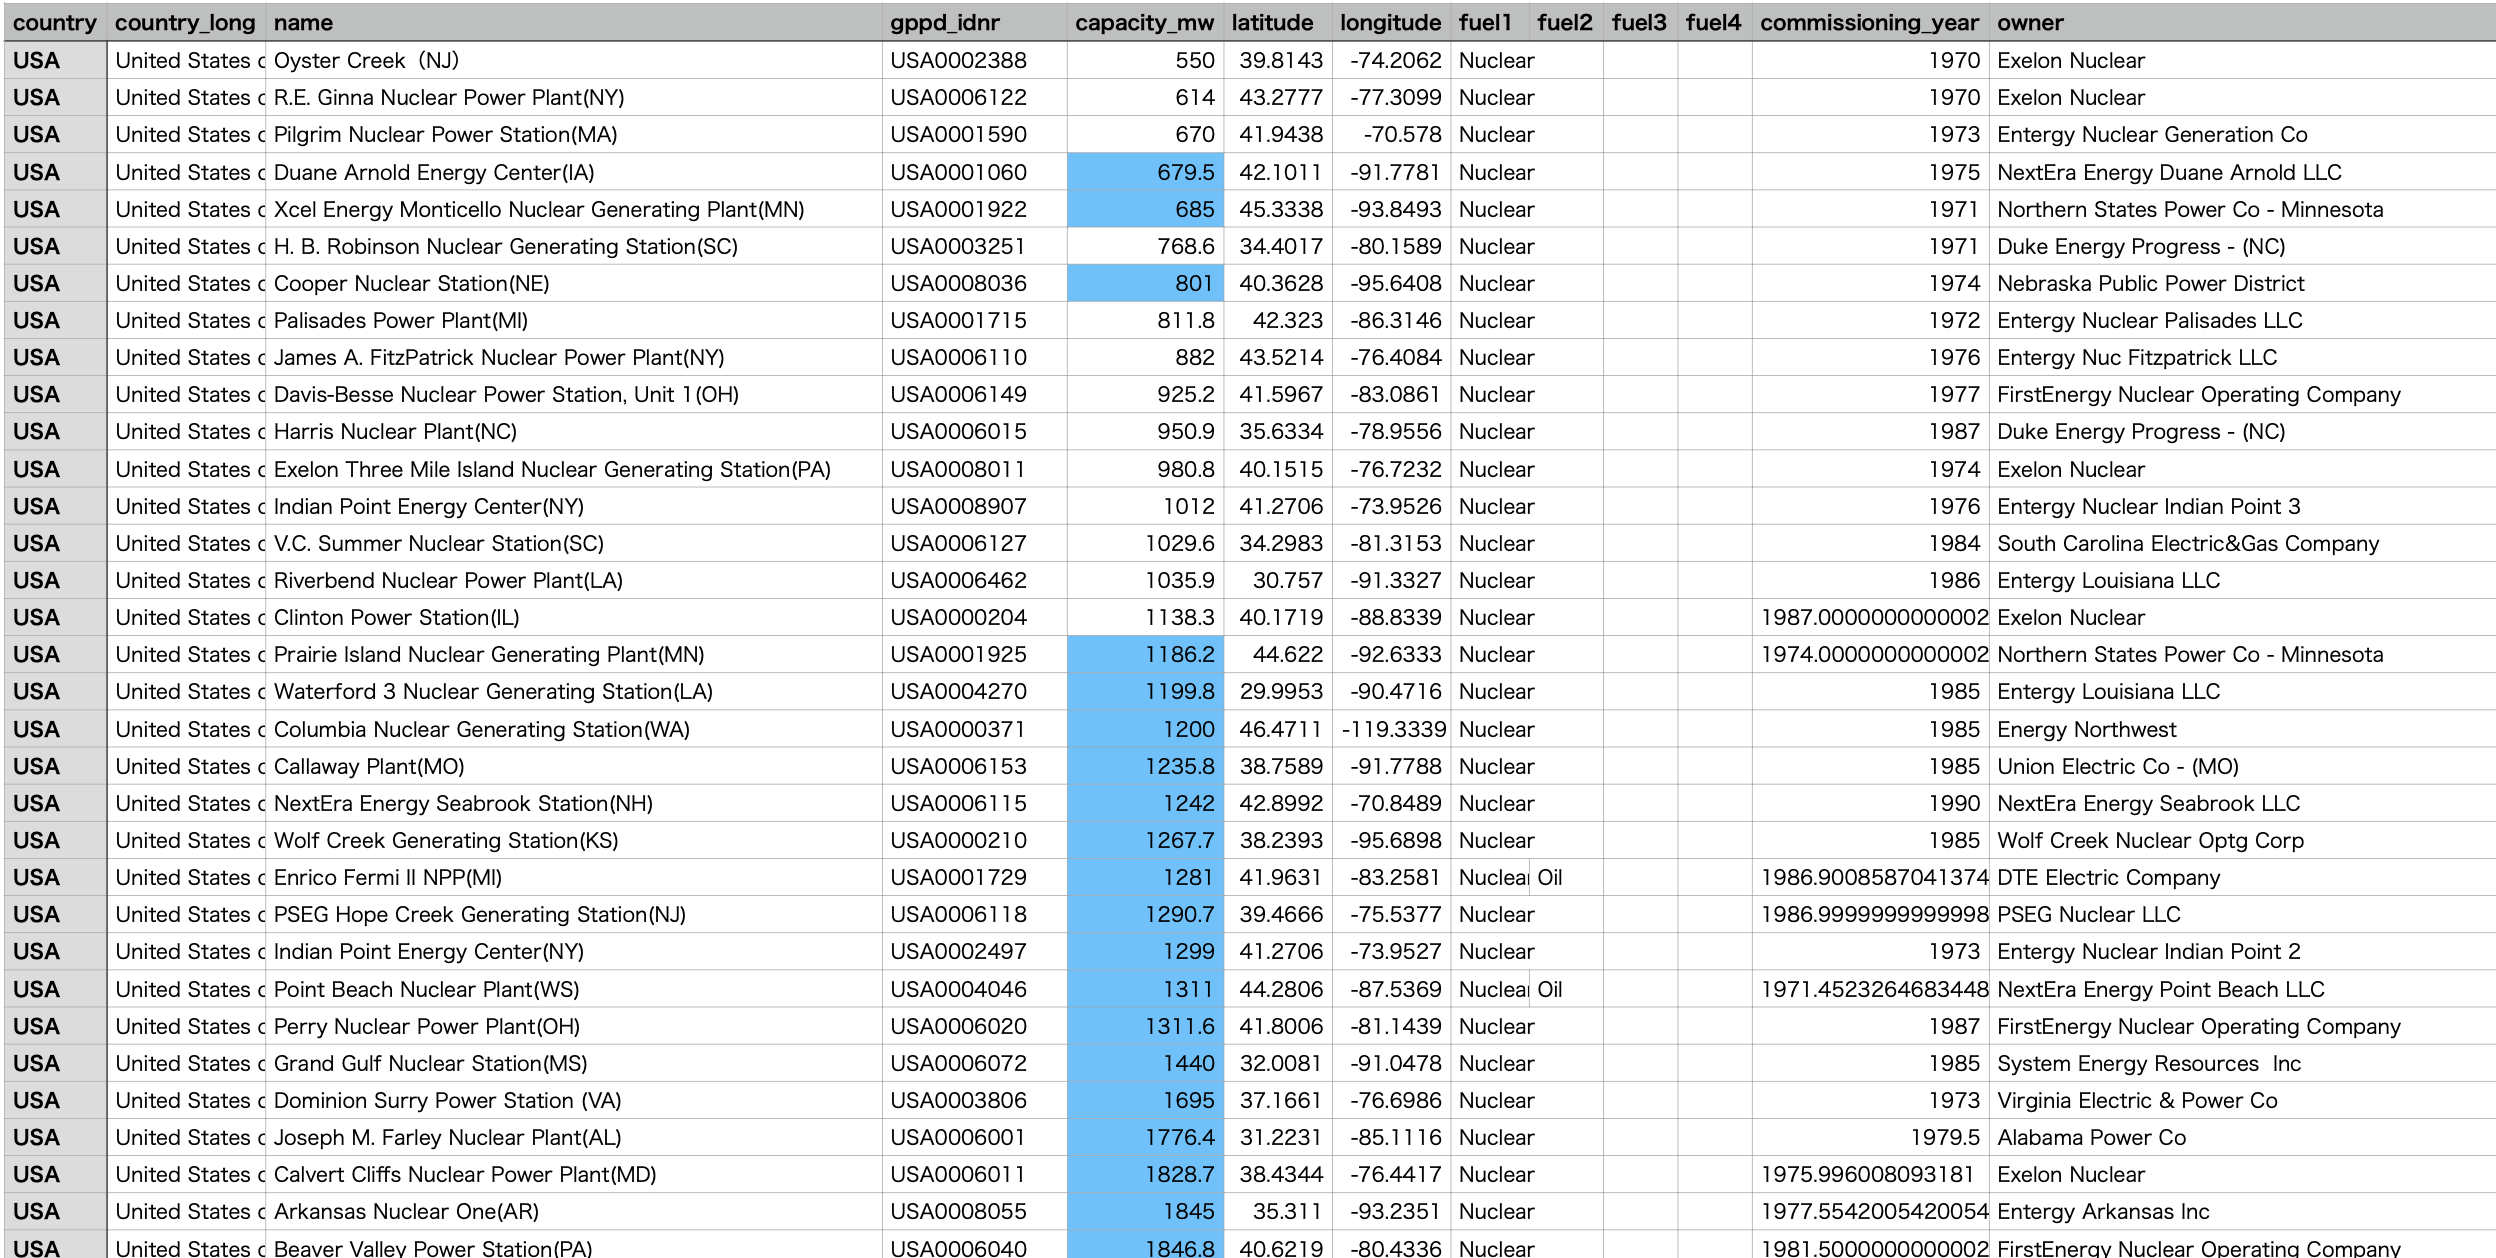
This project aimed to further understand the energy network and its issue in the US by visualizing the existing data. Comparison of the population density and the nuclear plants can conjecture the timeline of economic development and the correlation between social growth and consumption. I started the map focusing on nuclear plants, but this is just the beginning; we still rely on oil, gas, and coal and are going for "new" energy, such as shale gas.
As a next step of this project, I plan to see deeper into this topic by adding all of these to the map.
DESIGN DECISION
I used bright yellow on the calming blue background to show the data clearly. This also enhanced the topic's narrative, the energy production in the US by state.
Since the data I'm using is detailed and has so many layers of information, such as the plant owner, age, etc., I chose to focus on the amount of energy production, its location, and the population of each state.
You can see the design process below;